Creating Value: 1986 – 2025 NSSF Financial Performance
Tuesday, July 28 2026 12:22 pm
By Arthur Tugume, Financial Accountant




This is a comprehensive analysis of key financial performance indicators from 1986 to 2025. The study evaluates trends in operating income, total assets, member funds, contributions, benefits paid, operating expenses, interest declared, and cost-to-income ratio. The findings reveal a clear institutional evolution from a nascent, volatile entity into a mature, efficient, and large-scale pension fund.
Financial performance over time provides critical insight into institutional sustainability, operational efficiency, and strategic positioning. Below is the four-decade analysis of financial data, focusing on key performance indicators (KPIs).
1. Operating Income
NSSF’s operating income refers to the total revenue generated from its income-producing activities. This includes interest earned on investments, rental income from properties, dividend income from shares and equity investments, and other related sources of revenue accrued by the institution. Operating income serves as an important indicator of how effectively the institution’s income-generating activities are performing. It reflects the efficiency of investment decisions, asset management, and overall financial performance. A strong operating income suggests that the institution is successfully managing its resources to generate sustainable returns, which supports its long-term financial stability and ability to meet its obligations to members.
The table below displays the growth in operating income from 1986 to 2025.
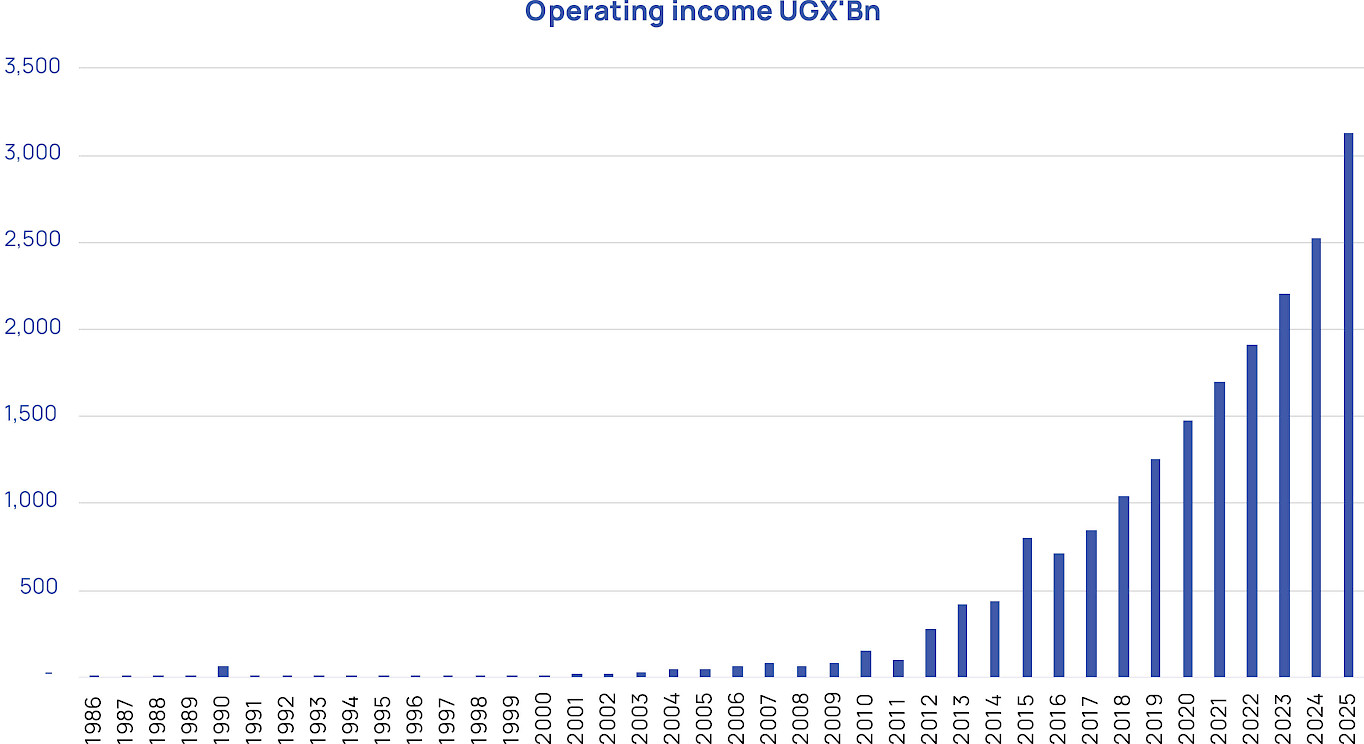
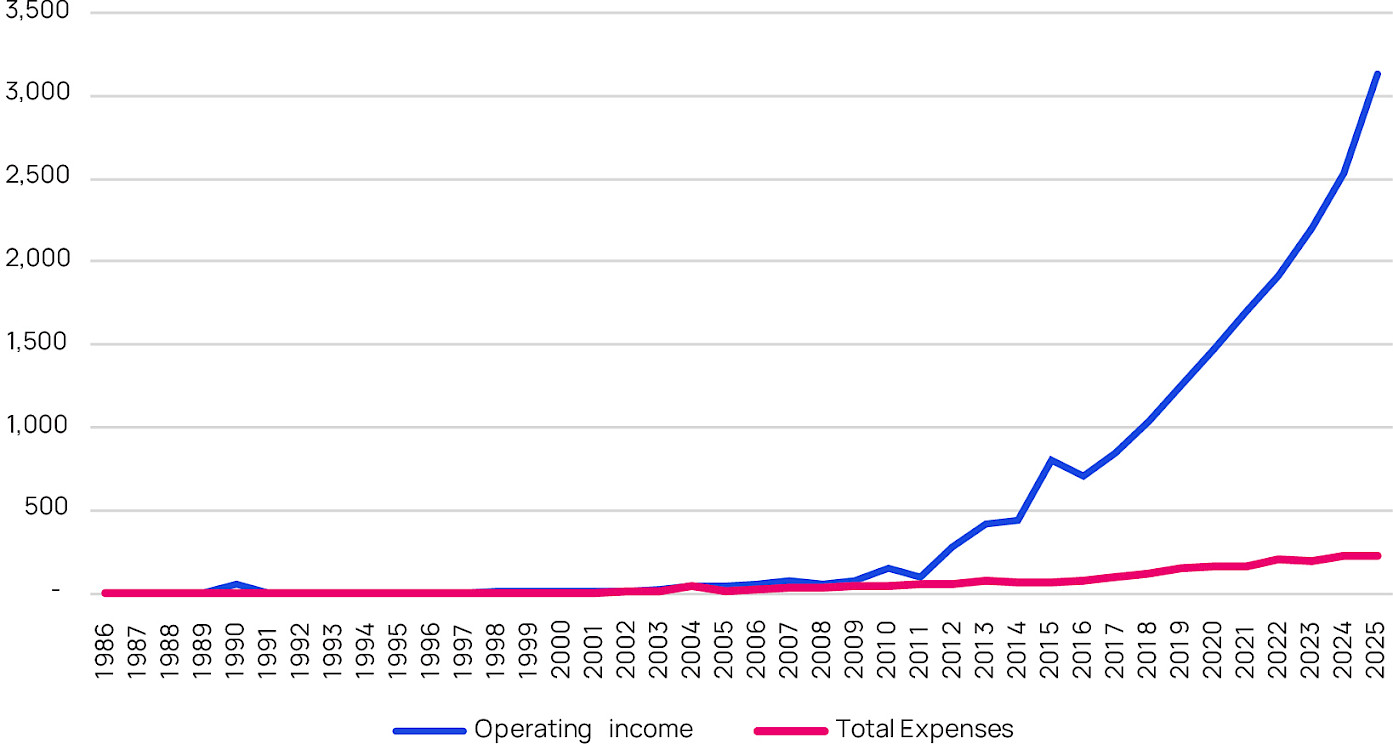
Operating income demonstrates a strong upward trajectory over the 40-year period, increasing from UGX 1 billion in 1986 to UGX 3.1 trillion in 2025. Early years (1986–2005) were characterized by low and inconsistent earnings, reflecting a formative stage of development.
Between 2006 and 2013, income growth stabilized, followed by a brief period of volatility between 2014 and 2016. From 2017 onwards, operating income expanded rapidly and consistently, signaling improved investment performance and institutional maturity.
This sustained growth indicates enhanced revenue-generating capacity, driven by asset expansion and improved portfolio management.
2. Total Assets
Total Assets represent the aggregate value of all economic resources owned and controlled by NSSF that are available to meet present and future obligations to members and beneficiaries. They reflect the financial strength, stability, and long-term sustainability of the fund. NSSF’s assets include cash and cash equivalents, fixed income investments, equities, real estate and investment properties, alternative investments, receivables, property, plant and equipment (PPE), and intangible assets.
Over the past 40 years, NSSF has steadily grown its asset base to exceed UGX 26 trillion as of June 2025, reflecting sustained member contributions, prudent investment management, and consistent long-term accumulation. The most significant acceleration occurs after 2010, suggesting the onset of compounding growth dynamics.
The graph below shows growth in total assets between 1986 and 2025.
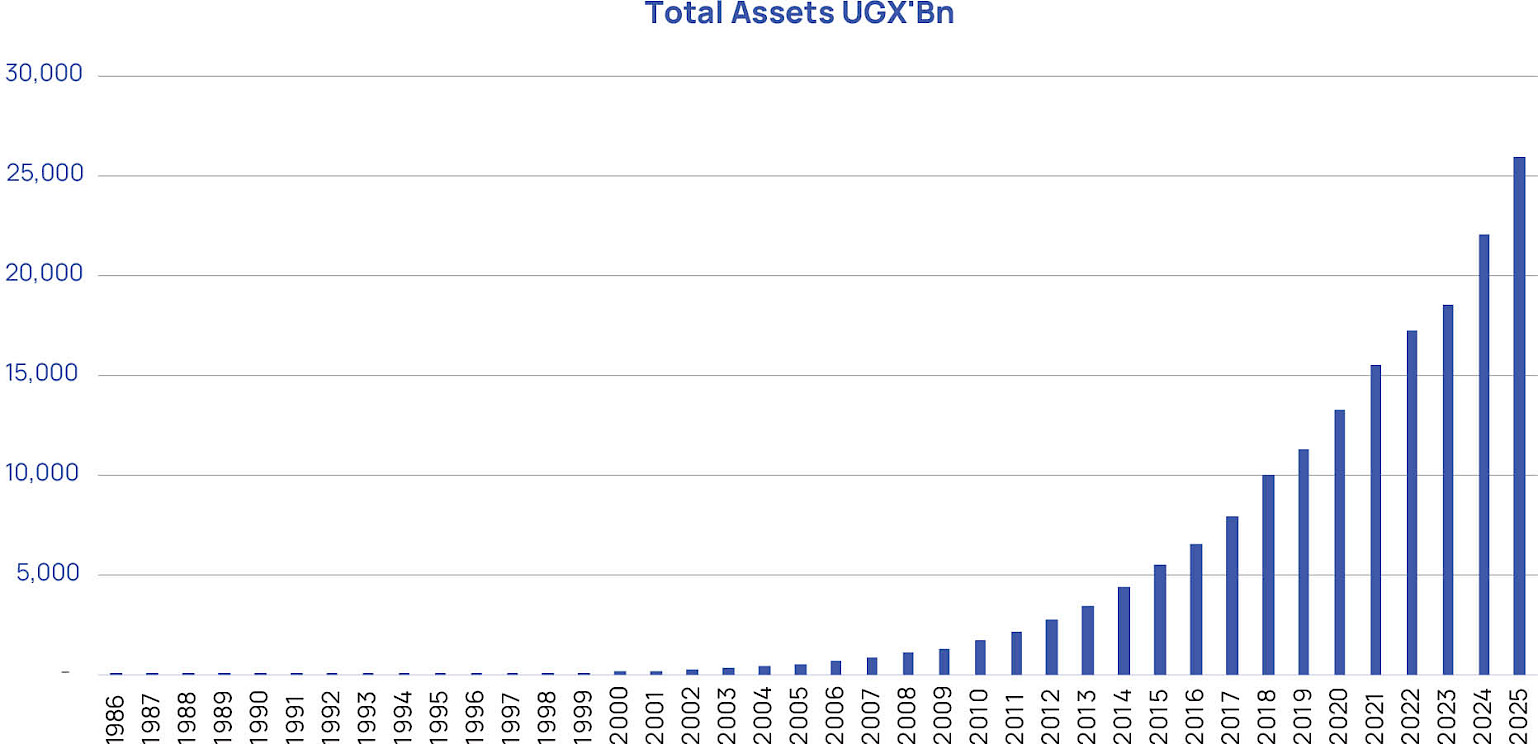
The growth in total assets shows a compound average growth rate of 18% year on year. The trend in growth of total assets is reflective of the trend in the growth of accumulated members’ funds. Increase in members’ funds over time has made more funding available to NSSF, thereby enabling more assets to be acquired and investment income.
NSSF’s assets are prudently invested in a portfolio of asset classes, and broadly as of June 2025 these are
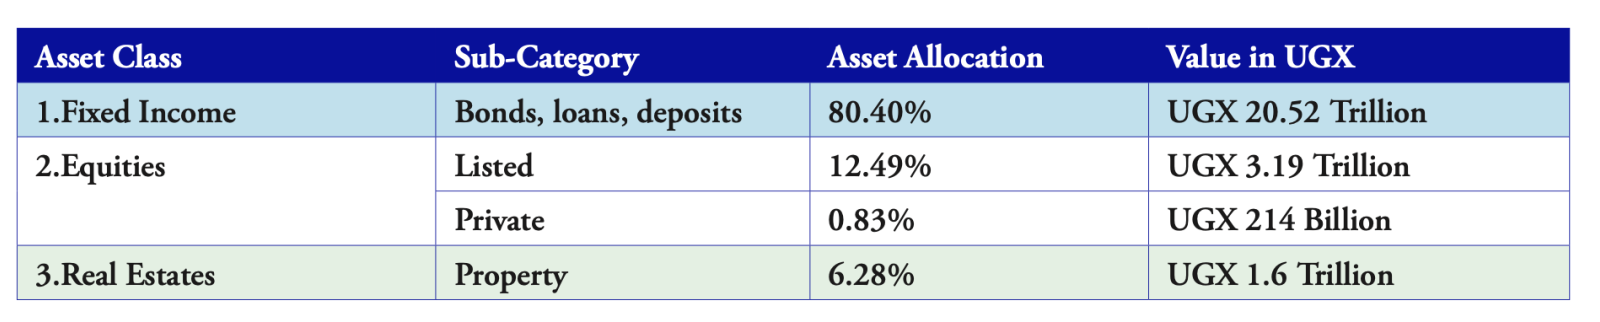
This strategic asset allocation indicates an investment strategy that is both aggressive and yet prudent, leaving no chance for idle resources. This has witnessed NSSF offering better than average returns that has also contributed to increased revenues. This has enabled the Fund to provide members with double-digit returns in the last 15 years.
3. Accumulated Members’ Funds
Over the past 40 years, NSSF members have consistently made contributions to the Fund. These contributions accumulate over time and are credited with interest as declared annually.
The amount reflected in NSSF’s books as accumulated members’ funds represents the total contributions received to date plus interest credited less the total benefits paid out.
Member funds closely track total assets throughout the period, reaching UGX 25.5 trillion in 2025. This near equivalence suggests a conservative financial structure with minimal reliance on external leverage.
Such alignment is characteristic of pension or provident funds, where assets are primarily funded by member contributions. The result is a strong solvency position and reduced financial risk.
The performance is presented in the graph below
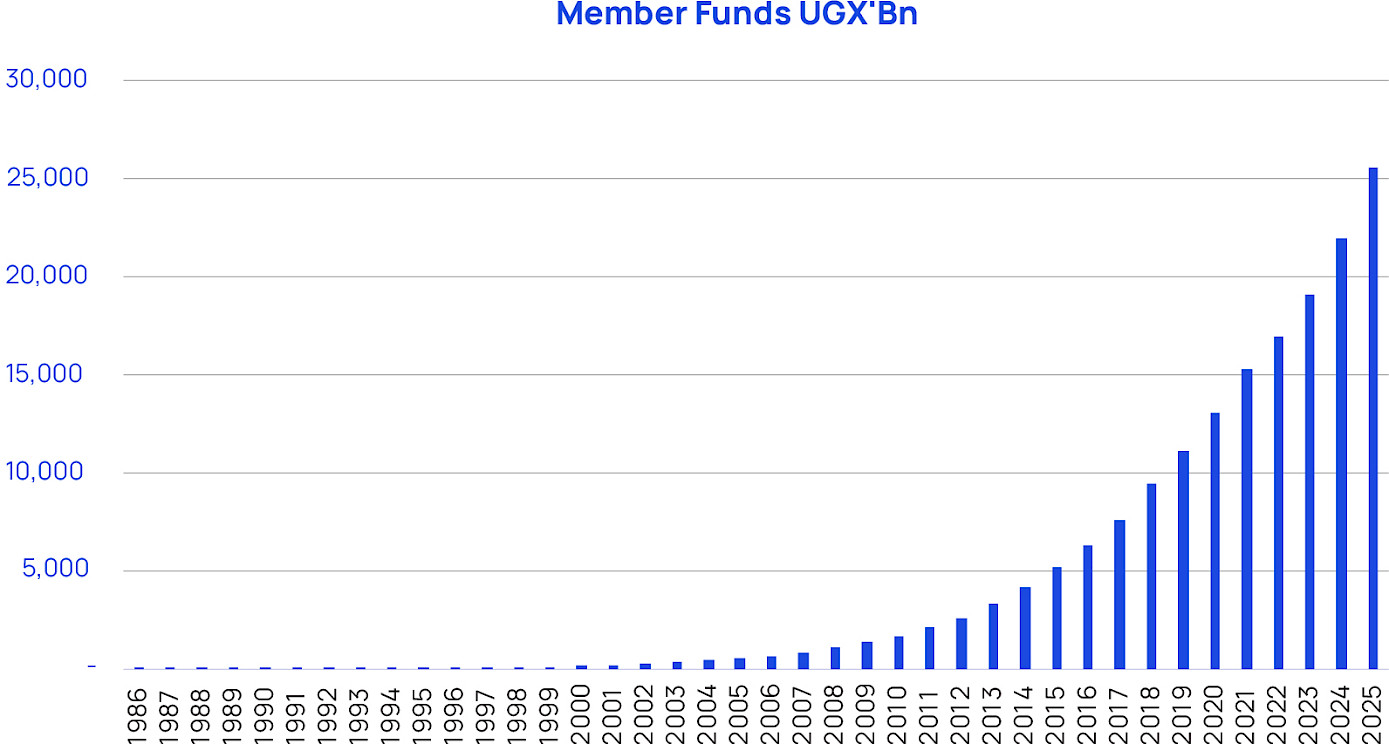
The growth in members’ funds is aligned with the growth in total assets. As of June 2025, accumulated members’ funds represent 98% of the Fund’s total assets.
While NSSF’s total assets amount to UGX 26 trillion, accumulated members’ funds stand at UGX 25.5 trillion. This demonstrates that the Fund holds sufficient assets to meet members’ obligations as and when they fall due.
4. Contributions collected during each year
On a monthly basis, employers make contributions to NSSF on behalf of their employees. The employee and employer contribution rates are 5% and 10%, respectively. An analysis of the contributions collected each year provides a good measure of how effectively NSSF is promoting compliance among employer organizations in remitting their employees’ contributions.
Contributions show steady and resilient growth, rising from negligible levels in the early years to UGX 2.1 trillion in 2025. The growth becomes more pronounced after 2005 and remains consistent through 2025.
The performance of annual contributions is shown in the graph below.
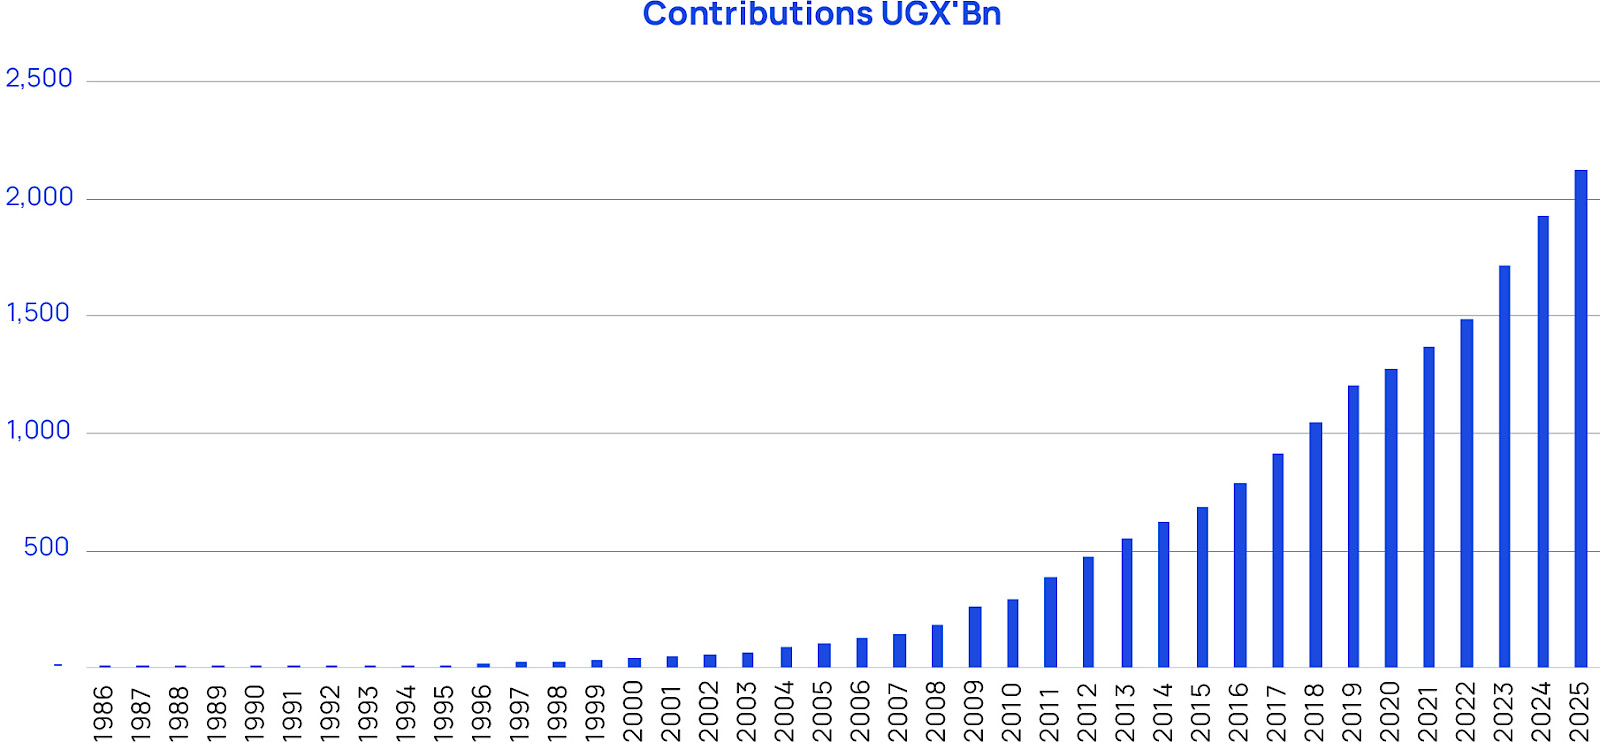
This trend reflects increased membership, higher wages, and policy-driven expansion into the informal sector in recent years. Contributions form a stable and predictable inflow, supporting liquidity and long-term investment.
However, the growth rate is slightly slowing compared to the growth of total assets, suggesting that the scheme’s expansion is increasingly driven by investment income than new contributions.
5. Benefits paid out
Benefits are paid from the accumulated members’ funds as and when members qualify to access their savings. There are seven types of benefits i.e., age benefits, withdrawal benefits, exempted employee benefits, invalidity benefits, survivors’ benefits, immigration grant benefits, and mid-term benefits.
At payout, members receive a lump sum payment consisting of contributions and interest compounded every year.
Below is a graph of benefits paid out from 1986 to 2025.
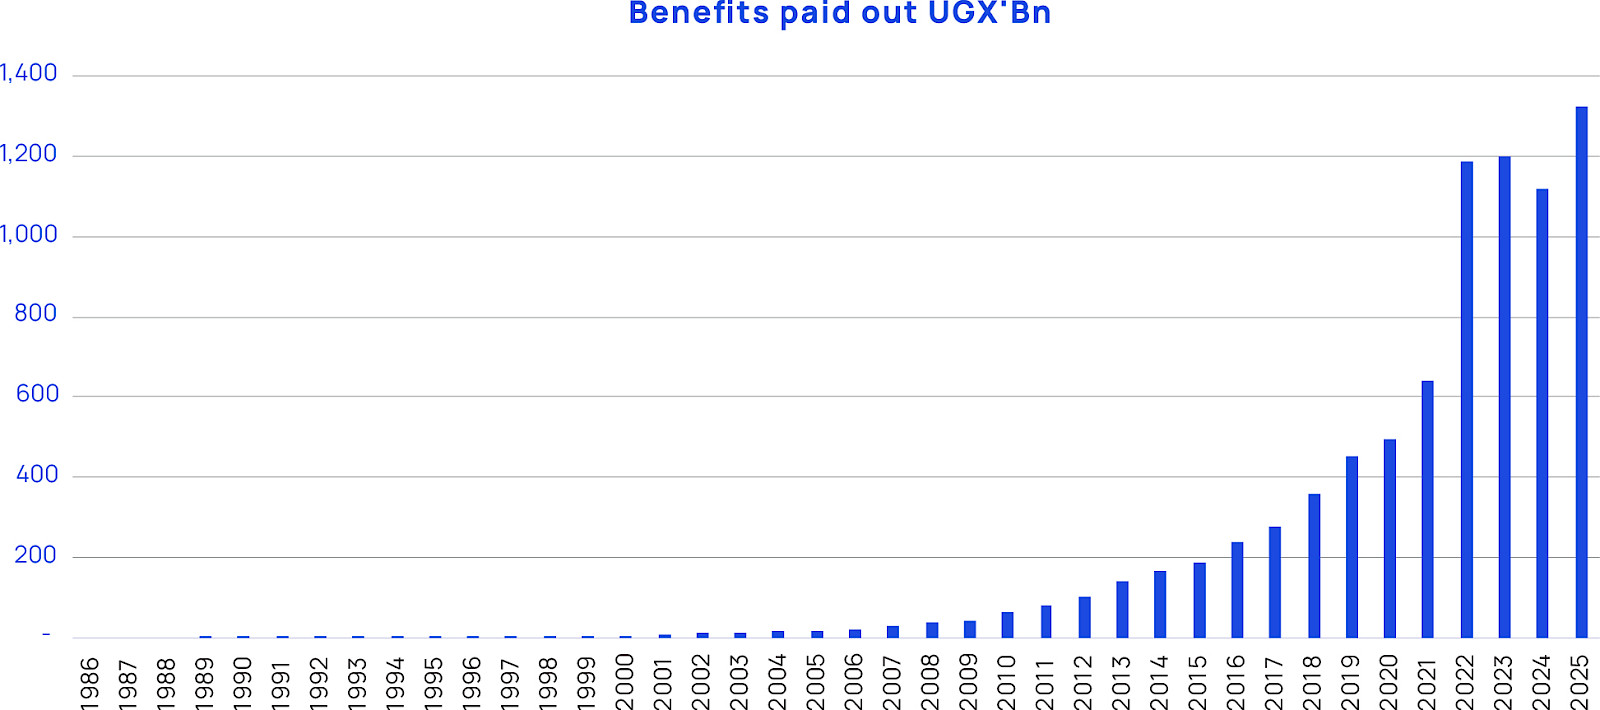
Benefit payments are increasing at a faster rate than contribution collected. Benefits paid currently amount to 62% of contributions collected compared to 27% 10 years ago. This growth differential indicates that outflows are accelerating more rapidly than inflows, which may gradually reduce the scheme’s surplus if the trend persists. The big jump in 2022 compared to 2021 was due to the introduction of mid-term benefits.
Although contributions still exceed benefits, the narrowing gap signals a transition toward a payout-intensive phase. This trend introduces potential liquidity and sustainability considerations for the future.
6. Interest Rate Declared on Savings
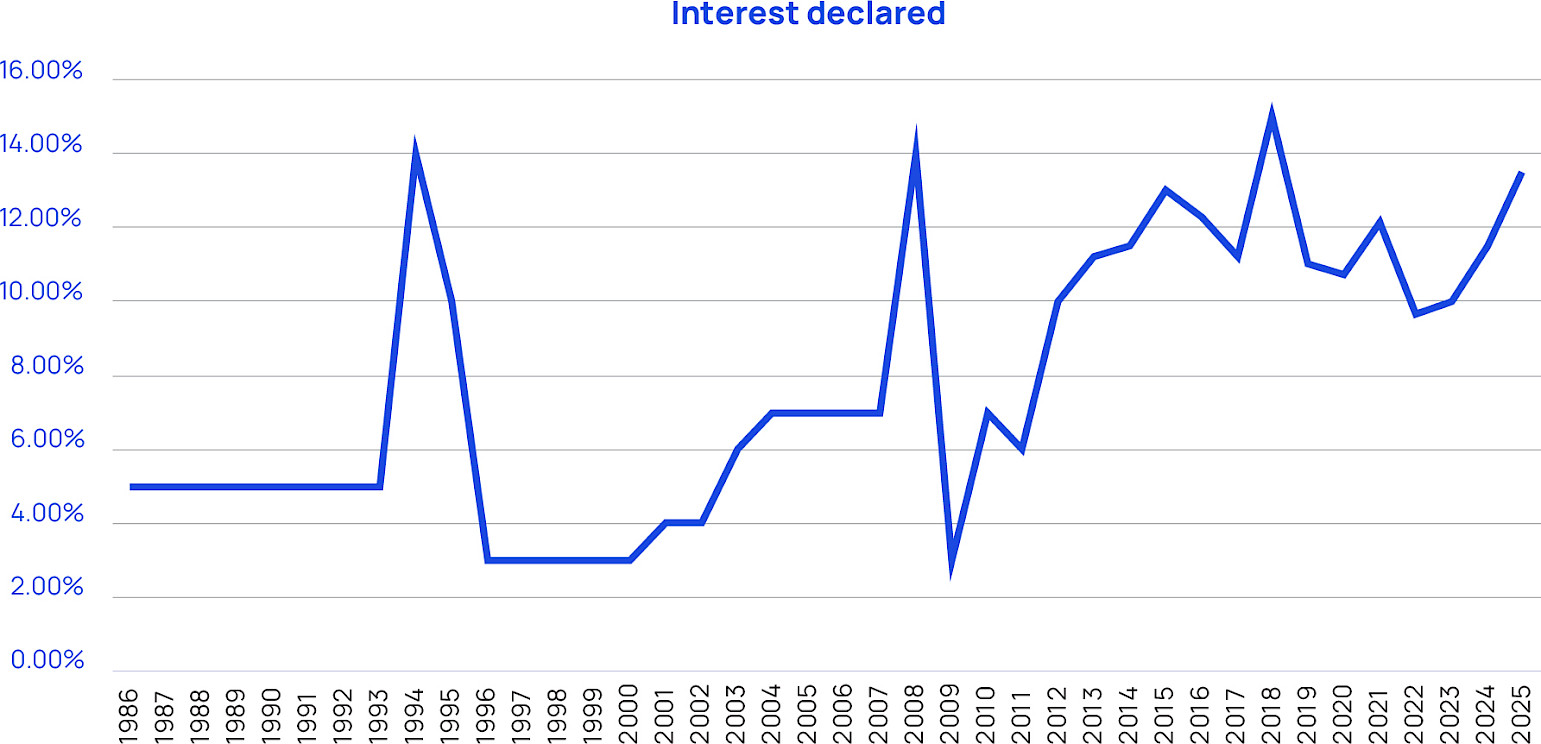
NSSF annually declares interest to its members, which is credited to their individual accounts. The interest declared represents the Fund’s performance for that year and is determined by the income earned and expenses incurred during the period.
Over the past 40 years, the trend in the interest rates declared has been as shown in the graph below.
7. Total Expenses
NSSF’s expenses include administrative expenses, operating expenses, depreciation and amortization.
The growth in expenses has been effectively controlled relative to income growth. NSSF has maintained the cost of administration below 1% compared to the industry average of 2.2%, demonstrating exceptional operational efficiency. This means that only a very small proportion of the revenue generated is consumed by administrative and operational expenses. This reflects strong cost management practices, disciplined expenditure controls, and efficient resource utilization. Overall, this level of efficiency positions the institution as highly cost-effective and financially well-managed.
The Total Expenses over the past 40 years are as shown in the graph below:
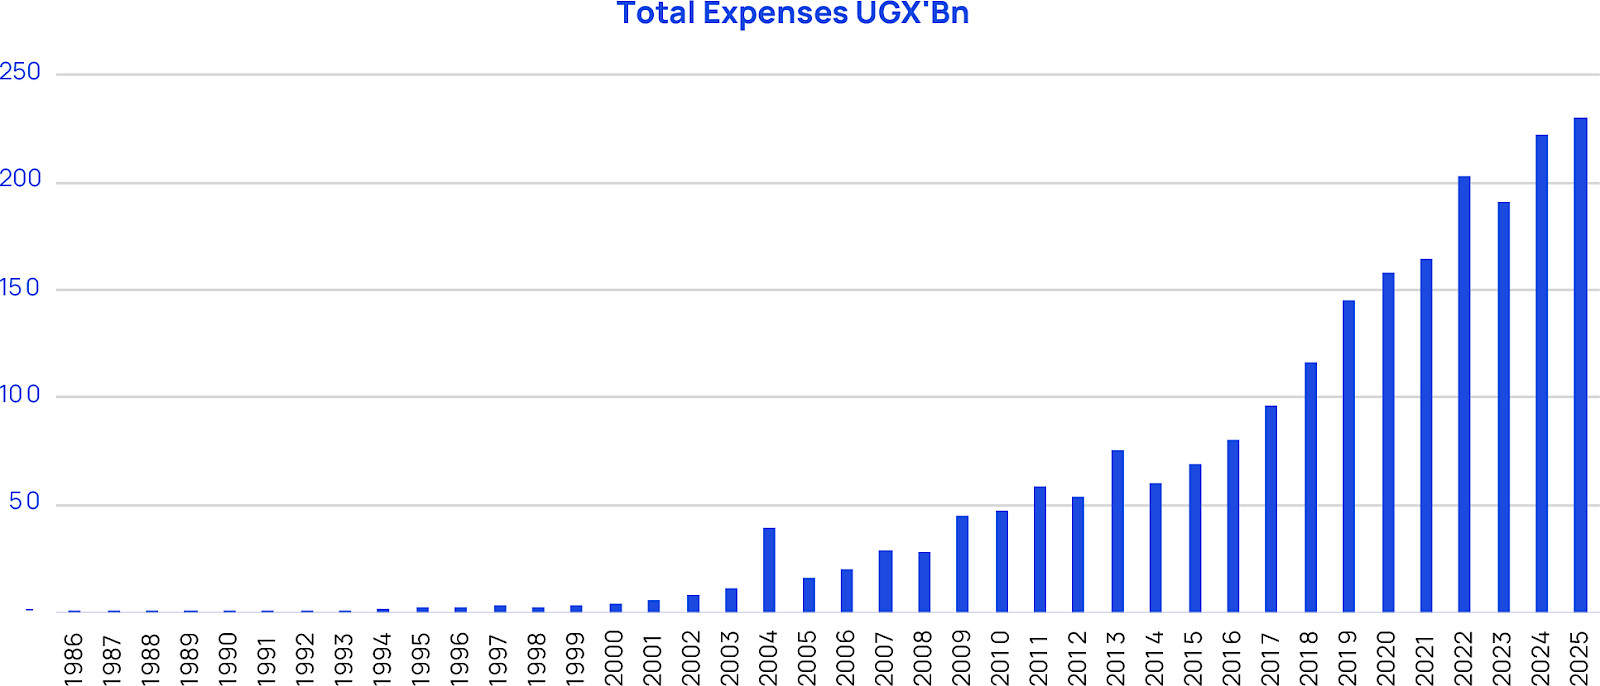
Operating expenses increased from minimal levels to UGX 230 billion in 2025. However, the growth rate of expenses remains significantly lower than that of operating income.
This divergence indicates strong operational efficiency and the realization of economies of scale.
8. Cost Income Ratio
This is an efficiency ratio that shows institution’s costs in relation to income.
Below is a graph illustrating how costs have changed relative to income over the past 40 years.
Historical Perspective
- 1990s: The cost-to-income ratio was extremely high, largely due to startup inefficiencies, structural setup costs, and the operational challenges associated with building institutional systems and capacity.
- Early 2000s: The ratio ranged between 35% and 98%, reflecting a transition period characterized by restructuring, system upgrades, and efforts to stabilize operations.
- From 2010 onward: The ratio consistently remained below 15%, demonstrating significant improvements in cost management, operational discipline, and efficiency gains driven by better governance and technology adoption.
The ratio declined further to a record low of 8% in 2025 marking the most efficient year in the institution’s history.
Global Comparison
For context, many global pension funds typically operate within a cost-to-income range of 10% to 20%. Achieving an 8% ratio places the Fund among the most operationally efficient pension funds internationally.
This sustained improvement in the cost-to-income ratio reflects disciplined expenditure control, economies of scale, strong financial oversight, and continuous operational improvement with clear indicators of world-class operational efficiency.
9. Conclusion
The analysis demonstrates a remarkable transformation over four decades, with the Fund achieving substantial growth, operational efficiency, and financial stability. NSSF’s strong asset base and consistent income generation underscore its success.
However, the increasing rate of benefit payments marks a shift toward a more mature phase, where sustainability will depend on effective asset-liability management and prudent investment strategies. Future success will rely not only on continued growth but also on the ability to manage rising obligations while maintaining competitive returns.